

Statistical Models include issues such as statistical characterization of numerical data, estimating the probabilistic future behavior of a system based on past behavior, extrapolation or interpolation of data based on some best-fit, error estimates of observations, or spectral analysis of data or model generated output. The HP 20b supports 8 Statistical Models.
Statistics operations require the use of two secondary function keys [Shift][Stats] and [Shift][Data]. The Statistics Menu is used to analyze the data. If you attempt to open the Statistics (Stats) menu before entering data, you will be redirected to the Data menu. The Data menu is use primarily to enter statistical data. To reset the Stats and Data menus, press [Shift][Reset] and at the ‘Stats=’ prompt, confirm your choice by pressing [INPUT].
HP 20b Data Entry:
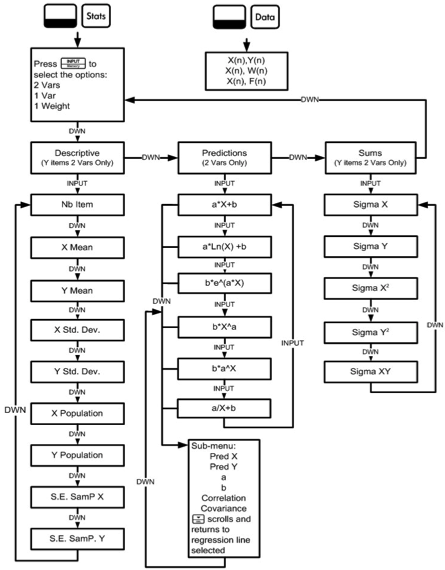
Press [Shift][Data] put it into data entry mode. When opened, the menu displays ‘2Vars’. Press [INPUT] repeatedly to scroll through the menu items: ‘2Vars’ two-variable, ‘1Var’ one-variable, and ‘1Weight’ one-variable weighted. Press [Down Arrow] with an item displayed to open the first sub-menu. To return from the sub-menu to the menu above it, press [Up Arrow].
Month = Sales Values
1 = 150
2 = 165
3 = 160
4 = 175
5 = 170
Here is the keystrokes to enter the above ‘2Vars’ two-variable data into the HP 20b.
- [Shift][Data] Opens Data menu starting with the current value for X(1).
- 1 [INPUT] 150 [INPUT] Displays current value for next X(2).
- 2 [INPUT] 165 [INPUT] Displays current value for next X(3).
- 3 [INPUT] 160 [INPUT] Displays current value for next X(4).
- 4 [INPUT] 175 [INPUT] Displays current value for next X(5).
- 5 [INPUT] 170 [INPUT] Displays current value for next X(6).
- As there is no X(6) data, Press [Shift][Stats] to opens Stats menu.
Lets do some statistical analysis on the HP 20b.
-
On the Stats Menu [Shift][Stats], Press [Down Arrow] to open ‘Descriptive’ sub-menu.
-
[INPUT] Displays 164.00 which is value for y average for the above data.
-
[Shift][Stats] and press [Down Arrow] [Down Arrow] to open ‘Predictions’ sub-menu.
-
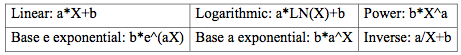
[INPUT] to select ‘Linear’ Predictions. Note: The Predictions sub-menu first asks you to choose a regression model. Six models are included:
-
[Down Arrow] to scrolls to current value of Prediction X.
-
Enter 7 and Press [INPUT] to input the value for Prediction X (month).
-
[Down Arrow] and press [=] Display 184.00, which is the predicted Y value (sales).